THETA GROUP RESEARCH
Historical and backtested results are presented to illustrate the characteristics of the framework and should not be interpreted as guarantees of future performance.
10 Years
Historical Backtesting
2,325 Trades
Filtered Historical Sample
+$280,049
Total Backtested P/L
-$3,594
Maximum Historical Drawdown — One 10-Wide Lot
+$28,005
Average Annual P/L
Nearly 8:1
Average Annual P/L / Max DD Ratio
643 Trades
Filtered Out by Pre-Entry Rules
22%
Approximate Portion of Original Trades Removed
The original time-based, near-zero-management version contained 2,968 trades and produced a Max DD of approximately -$5,632. The current pre-entry filters reduced the historical sample to 2,325 trades and reduced Max DD to -$3,594.
Performance Dashboard
10 years of backtested portfolio performance

Combined backtested ATP portfolio performance, August 2016 through July 2026.
Before Current Filters
Max DD: -$5,632
Trades: 2,968
Current Framework
Max DD: -$3,594
Trades: 2,325

The ATP Framework is evaluated across individual calendar years as well as the full combined period. Year-by-year analysis helps identify whether performance is dependent on a single market regime or remains productive across different volatility, trend, and macro environments.

Annual Chart 01

Annual Chart 02

Annual Chart 03

Annual Chart 04

Annual Chart 05

Annual Chart 06
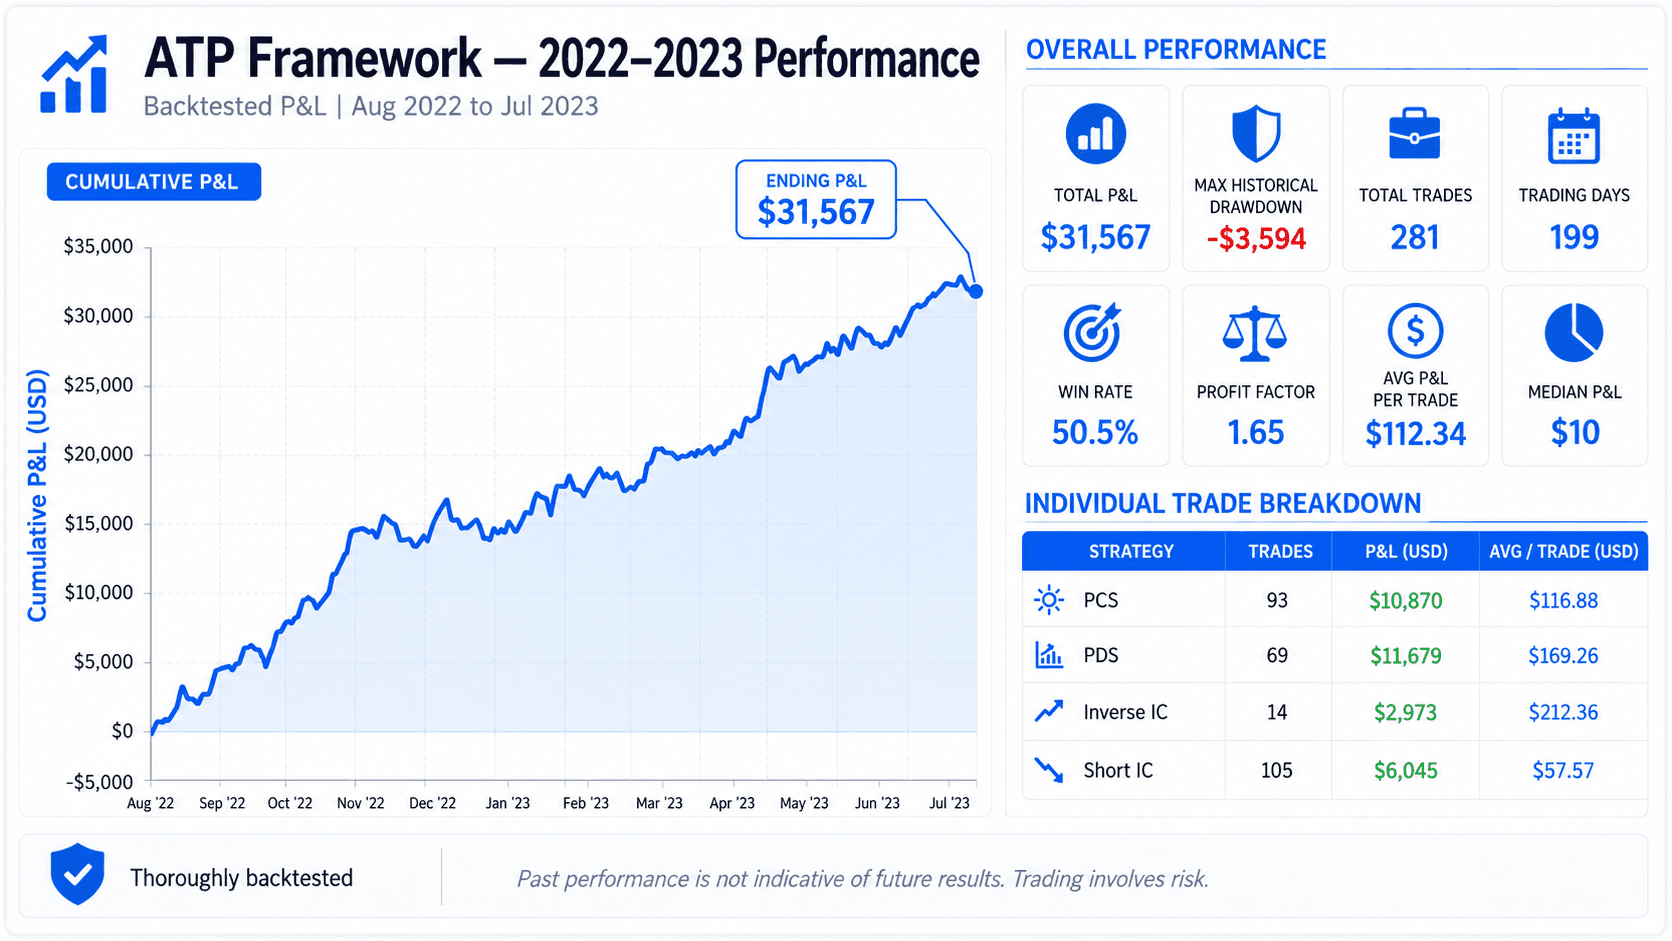
Annual Chart 07

Annual Chart 08

Annual Chart 09

Annual Chart 10
Time-Based Execution
Trade times are defined in advance rather than dependent on discretionary breakout timing.
Four Complementary Structures
The framework contains bullish, bearish, neutral-consolidation, and neutral-expansion structures.
Moving-Average Alignment
Directional structures are only taken when SPX is positioned on the appropriate side of the 100 SMA.
Pre-Entry Filtering
Each structure uses predefined conditions designed to remove historically weaker environments.
Adaptive Position Sizing
Directional exposure can increase or decrease based on historically tested TICK conditions.
Minimal Management
The framework is designed to reduce screen time and active decision-making after entry.
Portfolio-Level Risk Analysis
Changes are evaluated based on their effect on the combined four-structure portfolio, not simply on the performance of one individual strategy.
AI-Assisted Research
AI is used to organize, compare, and test historical conditions across large datasets. Final rules are based on historical backtesting rather than discretionary interpretation.
A More Mechanical Trading Process
The newest version of ATP was built around a simple objective: maintain strong historical portfolio characteristics while reducing the amount of screen time, discretionary decision-making, and active trade management required.
Time-Based Directional Entries
PCS and PDS are no longer breakout-trigger entries. Both directional structures are evaluated and entered at 10:00 CST when their required conditions are met. Directional trades are only taken on the appropriate side of the 100 SMA on the 10-minute SPX chart.
Near-Zero Trade Management
The portfolio is designed to require as little active management as possible. The PCS and Short Iron Condor are closed at 2:45 CST, approximately 15 minutes before the market close. The PDS and Inverse Iron Condor do not require an intraday managed exit under the current framework.
Structure-Specific Pre-Entry Filters
Each of the four trade structures has its own unique pre-entry conditions. Most filters are based on the previous trading session’s SPX price action. The Short Iron Condor additionally evaluates SPX price action during the hour immediately preceding its entry. If a structure does not meet its required conditions, no trade is taken.
Adaptive Position Sizing
PCS and PDS incorporate the NYSE TICK Index as an adaptive sizing input. Ten years of historical TICK data were cross-referenced with ten years of Option Omega trade results. The weakest quartile is filtered out, the middle two use standard position size, and the strongest directional quartile uses increased position size.
The Four Trade Structures
ATP is designed as a portfolio of complementary structures rather than a single directional strategy.
Inverse Iron Condor
Market Environment: Neutral expansion / volatility expansion. Entry: 8:30 CST at the market open. Current Construction: Slight upside skew. Role: Designed to participate when the market is positioned for larger movement rather than consolidation.
Put Credit Spread (PCS)
Market Environment: Bullish directional. Entry: 10:00 CST. Condition: SPX must be on the appropriate bullish side of the 100 SMA. Current Construction: At least one version is positioned slightly farther out of the money. Exit: 2:45 CST. Additional Layer: TICK-based filtering and adaptive sizing.
Put Debit Spread (PDS)
Market Environment: Bearish directional. Entry: 10:00 CST. Condition: SPX must be on the appropriate bearish side of the 100 SMA. Management: Designed as a minimal-management trade. Additional Layer: TICK-based filtering and adaptive sizing.
Short Iron Condor
Market Environment: Neutral consolidation. Entry: 12:00 CST. Current Construction: Upside-skewed. Exit: 2:45 CST. Pre-Entry Filter: Includes SPX price action during the hour before entry.
Directional Alignment
One of the most important findings in the historical research is that a significant portion of the directional edge comes from keeping the directional structures on the correct side of the moving average. PCS trades are only considered when SPX is positioned on the bullish side of the 100 SMA. PDS trades are only considered when SPX is positioned on the bearish side of the 100 SMA. Rather than waiting for an intraday breakout trigger, the current framework combines that directional alignment with fixed 10:00 CST entry times and pre-entry filtering.
Using Market Breadth to Adjust Exposure
The NYSE TICK Index measures real-time market breadth by comparing the number of NYSE stocks ticking higher with the number ticking lower. For the current ATP research, 10 years of historical TICK data were cross-referenced with 10 years of Option Omega backtesting results for the directional structures. AI-assisted analysis was used to separate the TICK readings into quartiles and compare the historical performance of each group.
WEAKEST QUARTILE
No Trade
MIDDLE TWO QUARTILES
Standard Size
STRONGEST QUARTILE
Increased Position Size
For PCS, the strongest bullish TICK quartile receives increased size while the weakest bullish condition is filtered out. For PDS, the logic is reversed: the strongest bearish TICK quartile receives increased size while the weakest bearish condition is filtered out. The purpose is to move position sizing away from discretion and toward predefined historical conditions.
Defined Entry Times
8:30 CST
Inverse Iron Condor
10:00 CST
PCS · PDS
12:00 CST
Short Iron Condor
2:45 CST
Close PCS · Close Short Iron Condor
When the required conditions are met, entry times are known in advance. Members do not need to wait for breakout triggers or continuously monitor the market for entries.
Position Sizing and Spread Width
The performance figures shown on this page are based on one 10-wide lot. The historical Max DD for the current 10-wide portfolio is approximately $3,594. Position sizing should be based on the amount of portfolio drawdown an individual trader is prepared to tolerate. Examples of possible drawdown targets include 10%, 20%, or 25% of allocated trading capital.
Five-wide spreads are expected to produce broadly similar performance characteristics at approximately half the dollar P/L and approximately half the dollar drawdown of the 10-wide version. Detailed position-sizing guidelines will be published separately.
Backtested and historical performance is presented for informational and educational purposes only. Past performance does not guarantee future results. Backtests involve assumptions and may not reflect actual execution, slippage, commissions, liquidity constraints, or future market conditions. Options trading involves substantial risk and is not suitable for every investor.